Brand traffic calculation — a ready-made solution in Data Studio
Branded traffic is clicks to a website from the search network for a query related to the company name. Such requests are also called vital. Its scale reveals your brand recognition, and its growth reveals the effectiveness of distribution.
There is enough material on the Internet about the benefits of branded traffic and how to attract it. In this article, I will not duplicate information, but will give a few main advantages of such traffic in order to finally convince you of its uniqueness.
Benefits of Branded Traffic:
- High positions in search results for branded queries.
- Growth in the conversion rate.
- Growth in the share of direct referrals.
- The emergence of natural links.
- Minimal dependence on changes in search algorithms.
- Improvement of behavioral factors for the site as a whole.
Given the attention paid to brand traffic and how to attract it, it is obvious that it is necessary to track and analyze its dynamics. And that’s why:
- When predicting total traffic, SEO specialists need to take into account the percentage of branded traffic, since it is impossible to directly influence it as part of site optimization work.
- You can track the offline activity of a business and notice that an increase or decrease in overall traffic occurred due to a change in the amount of branded traffic. For example, it rained on Wednesday and that day there was an increase in organic traffic to the site of the pizzeria.
- A low or declining percentage of brand traffic in general will encourage the marketing department to work on increasing brand awareness, as SEO is not capable of doing this alone.
We currently track branded traffic according to Search Console data, manually calculating the percentage of queries that contain brand mentions.
How can this be done quickly and clearly? Just connect your data to a ready report!
We have prepared a convenient two-page dashboard for calculating and analyzing the main brand traffic indicators. Now you do not need to calculate manually and estimate approximate values.
1 page — Brand traffic analysis
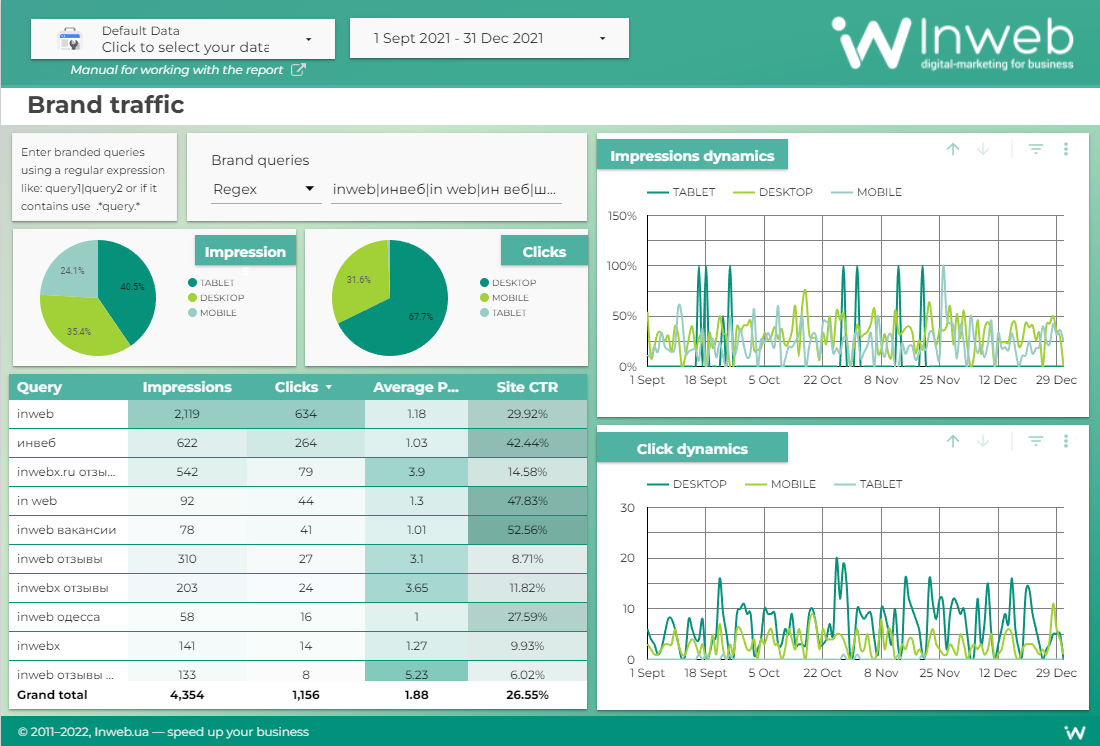
The report “pulls” data from the Search Console webmaster panel connected to your site, displays the main indicators (impressions and clicks *) and their dynamics over time by device type:
- Impressions is the number of times links to pages on your site appear in search results.
- clicks is the number of clicks on links to your site in Google search results.
*Excludes clicks on Google Ads search ads.
Along with this, the dashboard has a table with a list of queries and the parameters of each of them. In addition to impressions and clicks, the average position and CTR are also displayed here:
- average position is the average ranking of links to your site among other links for a certain number of requests. For example, if your site’s URL is listed in position three for one request and seven for another, the average position would be 5 ((3 + 7) / 2);
- CTR – click through rate – is measured as a percentage and is calculated using the formula: (number of clicks / number of impressions) * 100.
The report itself does not determine brand traffic, it displays it based on «brand constructs» that you need to enter into a special filter on the page.
Page 2 — Analysis of the volume of branded traffic (in-depth version)
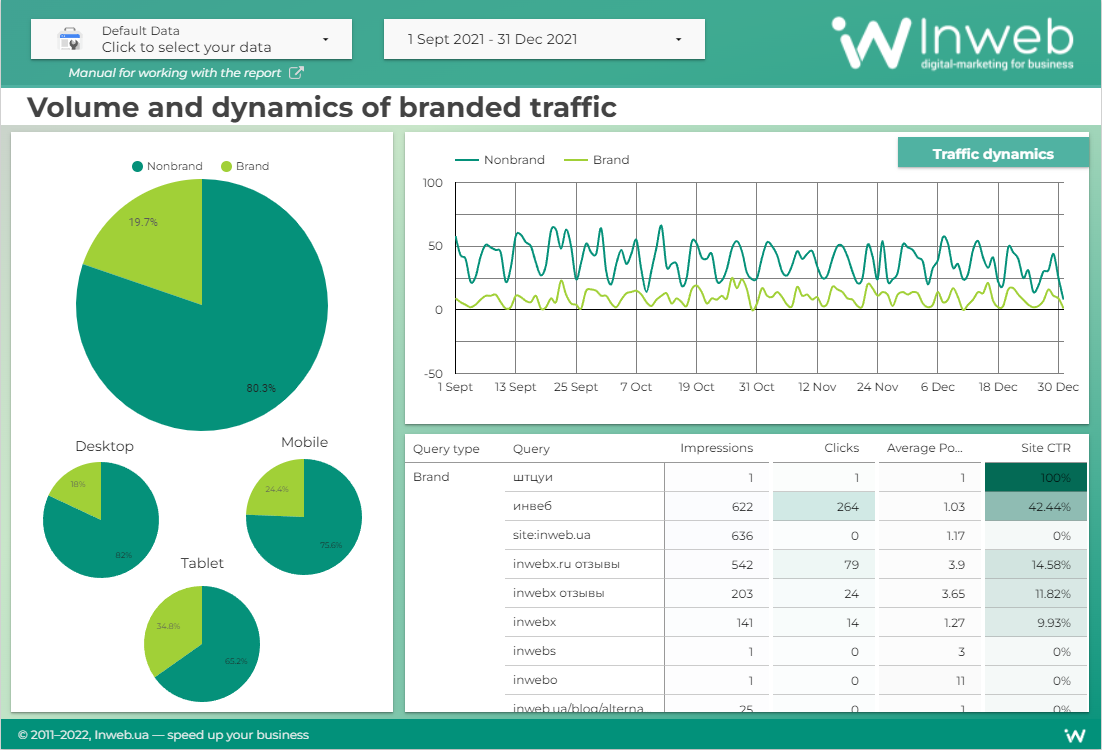
This report:
- calculates the percentage of branded traffic in the general search using the custom field «Query Type»;
- displays the percentage of branded traffic to everything by device type;
- shows the dynamics of branded traffic in comparison with non-branded ones;
- contains a pivot table with all search queries, while dividing them into branded and not.
Unlike the previous page, the report does not have a custom filter; to run it, you need to make changes to the «Query Type» custom field. How to do this is described below.
How to use this dashboard?
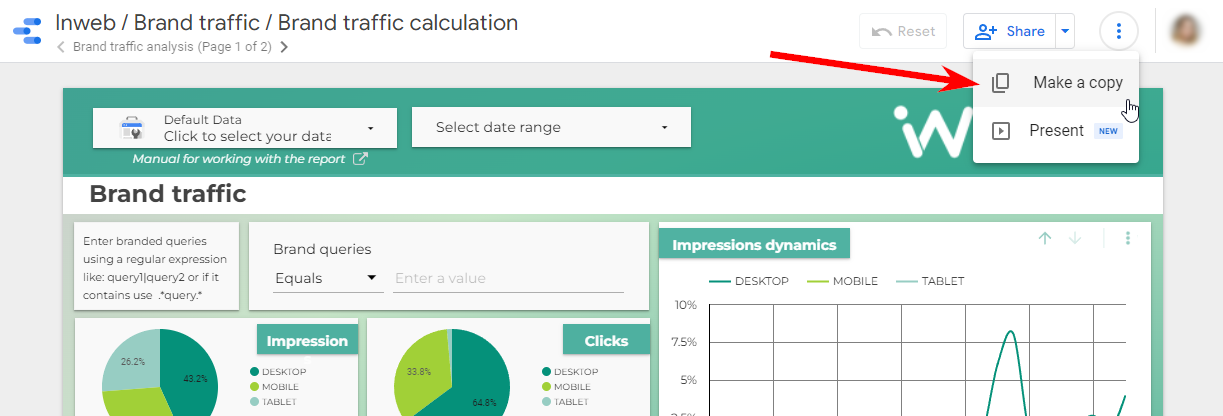
Step 1. To run your data into a report, first you need to make a copy of the dashboard for yourself:
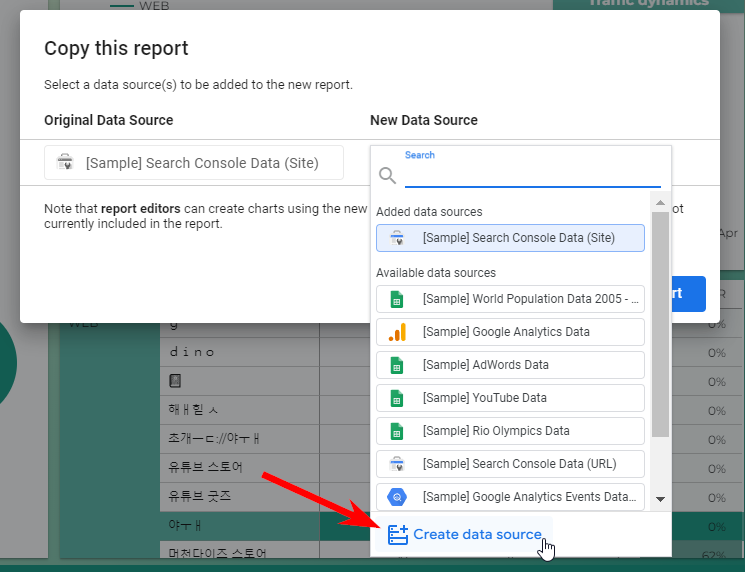
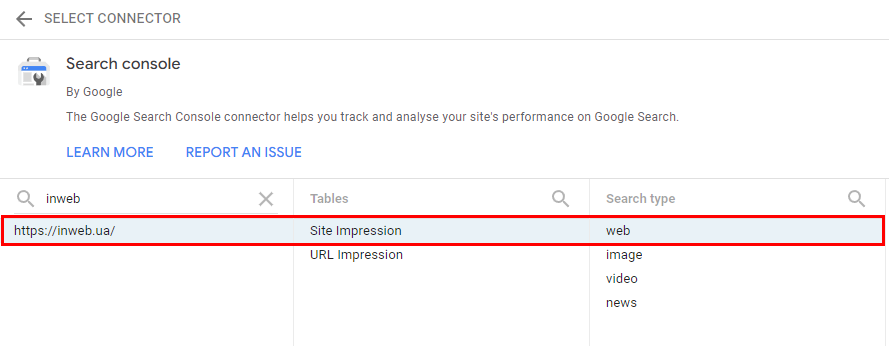
Step 2. Select your website from the drop down list or create a new Search Console data source:

Step 3. Carry out several manipulations:
Working with the first page of the dashboard
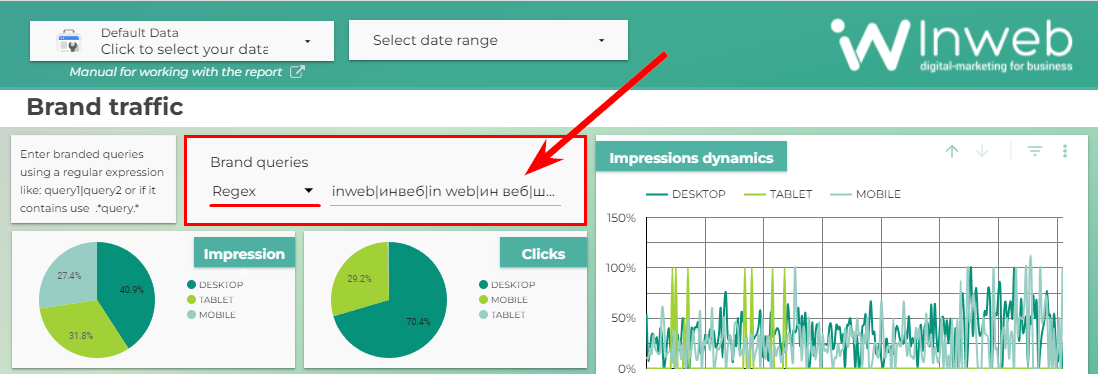
In the input field, enter all variations of the spelling of your brand name as a regular expression through the “|” symbol — (for example – inweb|инвеб|in web|ин веб|штцуи):
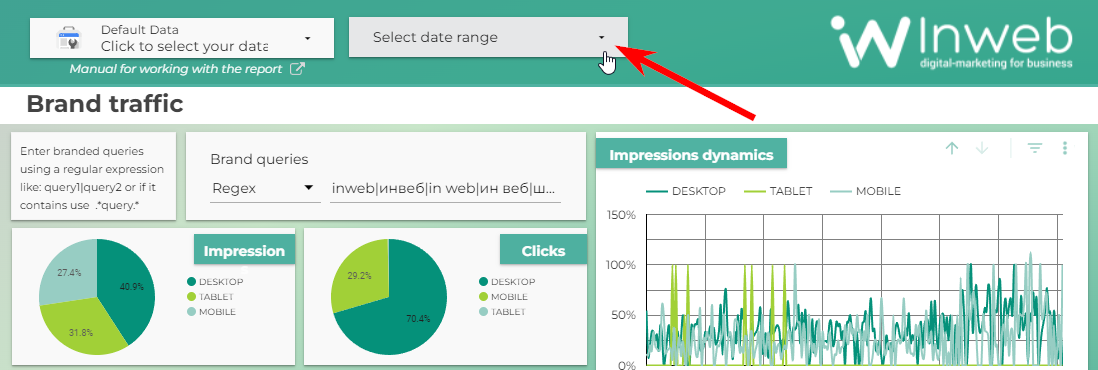
Specify date range:
Note! It is important to remember to change the filter type to a regular expression and list all possible brand spellings, taking into account possible spelling errors and keyboard layouts.
If this page of the report answers your questions, you can stop at this point and use the data. If you need a deeper study, namely the percentage of branded traffic, go to the next page.
Working with the second page of the dashboard
In edit mode, create a new field with the formula:
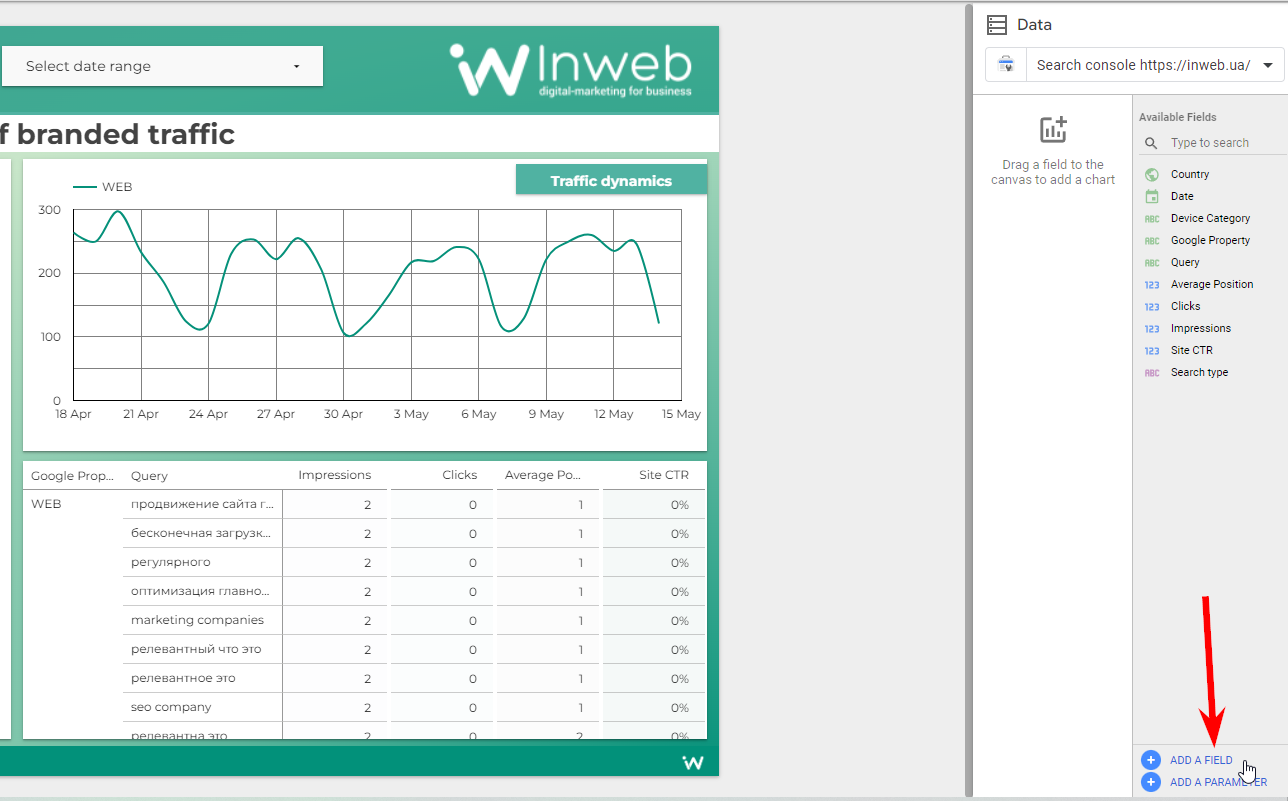
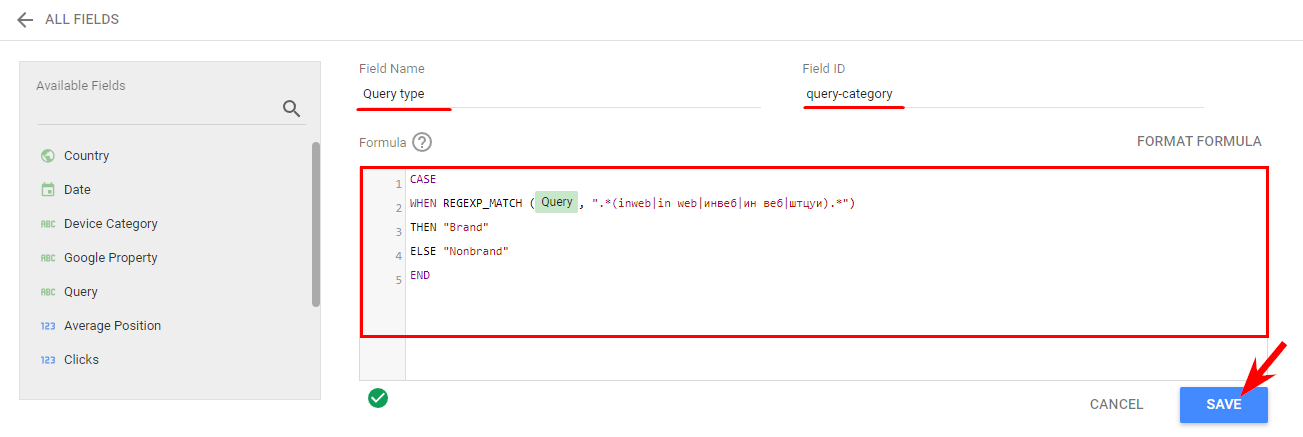
Field name: Request type
Field ID: query-category
Formula:
CASE
WHEN REGEXP_MATCH (Query, “.*(inweb|in web|инвеб|ин веб|штцуи).*”)
THEN “Brand”
ELSE “Nonbrand”
END
Where instead of inweb|in web|inweb|in web|штцуи, enter queries related to your brand in a similar regular expression format.
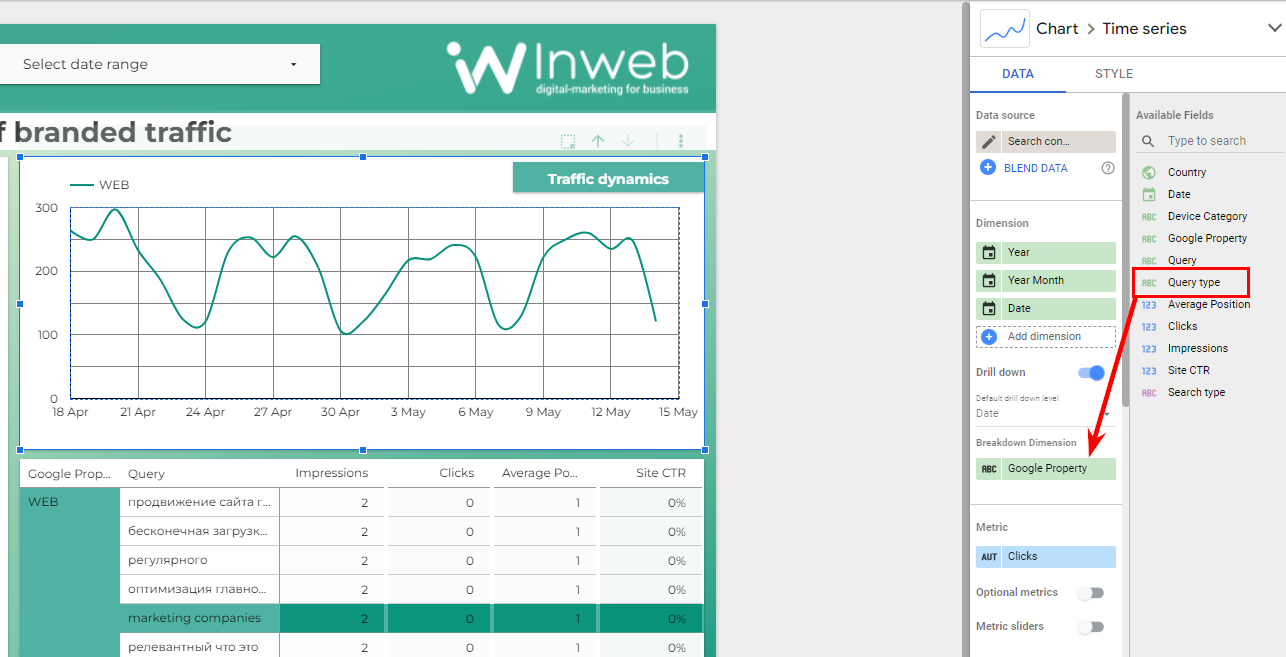
In each diagram of the second page of the dashboard, replace the «Google Property» parameter with the «Query Type» you created:
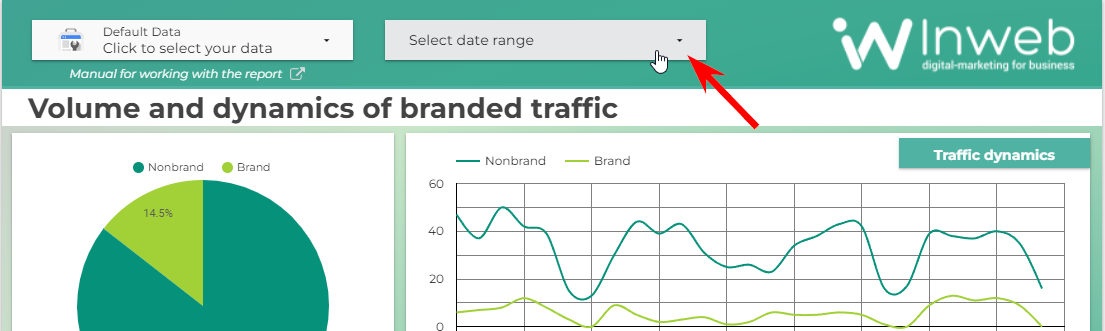
In view mode, select a date range and get ready-made data:
How to collect all mentions (mentions) of your brand?
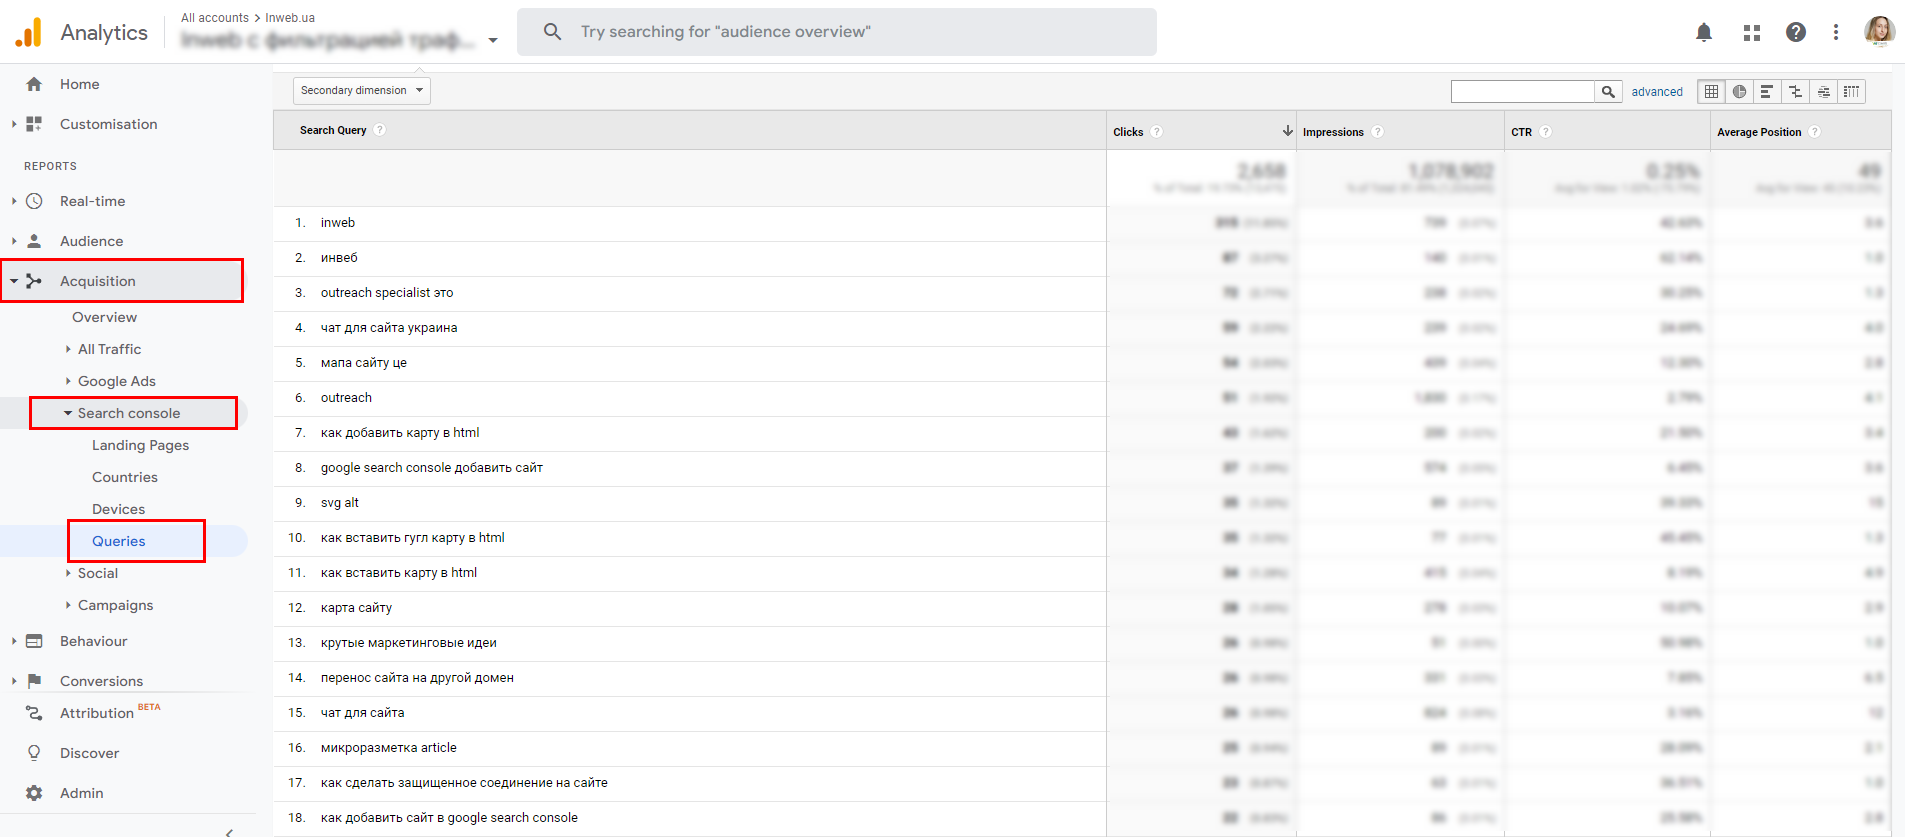
You can use Google Analytics or Search Console to compile a list of branded queries. You can do this:
1. using point sampling of brand spelling variations in the performance report data upload to Search Console or:
2. in the report on queries in Google Analytics, if integration with Search Console is enabled.

Conclusions or what will the dashboard show you?
- This report will show you the visual dynamics of brand awareness in the context of different types of devices.
- Allows you to quickly and easily calculate the percentage of branded traffic to the rest.
- It will help to analyze the effectiveness of activities aimed at promoting the brand, as well as the work of SEO specialists.
- Dashboard data will help to find out the reason for changes in traffic dynamics, make decisions on the use of certain promotion methods.
Analyze and increase your «branded» traffic, because a client who came by a branded request is 100% your client.

